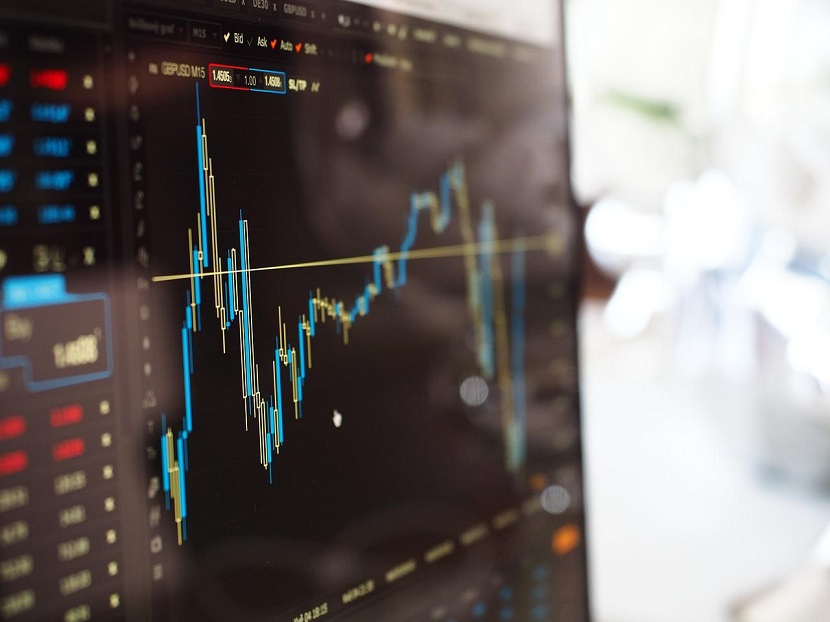
S&P 500 indicates a historic sharp bounce of markets, following Fed meeting.
The Federal Reserve’s anticipated interest rate increase on Wednesday may actually provide some respite for equity investors who are mired in despair.
The S&P 500 and the Nasdaq 100 Indexes have dropped 6.2% and 7% respectively during the previous six days.
This put pressure on US stock markets ahead of the Fed meeting on the remote chance Chairman Jerome Powell could adopt an even more aggressive posture to combat blistering inflation.
Eight out of ten Fed decisions over the previous 18 months have resulted in an increase for the S&P 500 Index. Stocks increased between 6% and 9% in the days following the Fed meetings in January, March, and June after falling precipitously in the lead-up.
According to Brad McMillan, chief investment officer at Commonwealth Financial Network, “expectations are highly hawkish, and the Fed can come out just as predicted and still be more dovish than expected.”
That probably limits the market’s potential fall from this meeting and might even offer some potential future gains.
The Fed is anticipated to raise rates for the sixth time in a row on Wednesday, bringing benchmark borrowing costs to 3.25%. Due to this, 10-year Treasury yields are now above 3.5%, which is the highest level since 2011, prompting many investors to sell their shares.
The huge bearish posture, however, may also work to the equities’ advantage. According to the most recent monthly survey from Bank of America Corporation, fund managers are more underweight in stocks than ever before, while cash reserves are at their greatest level ever.
By 7:04 a.m. in New York, S&P 500 futures had increased 0.3%, while Nasdaq 100 contracts had barely changed.
Another indicator, the CFTC’s S&P 500 net non-commercial futures, similarly exhibits a very pessimistic outlook and has risen to levels last seen in the recessions of 2008, 2011, 2015, and 2020. Such pessimism is frequently interpreted as a contrarian sign, signaling a recovery.
Particularly for technology shares, market technicals may also be signaling that a bottom is about to form.
Around 16% of the Nasdaq 100’s components are currently trading barely above their 200-day moving average, despite the fact that the tech-heavy index has been down by 27% this year.
With the exception of 2008, analysis suggests that this type of decreased technical breadth has been associated with past market bottoms.